Peter Few

BSc in Biological Science and 8 years of experience working with data
I want to further develop my data skills and will be displaying my projects here
View My LinkedIn Profile
Quality Monitoring Database and Dashboard for Laboratory Role
Project description: During a previous role as a Laboratory Technician, I took on a project to create a database in Excel and later a dashboard in Power BI. The database was required to monitor the quality of a laboratory process to meet the inspecting body (UKAS) requirements for certification.
1. Cleaning and Preparing the Data
First I added a tab to the analysis Excel worksheet and used IF statements to order the data into one line that could be copied and pasted into my new database table. When looking through past worksheets I realised that the data needed cleaning with various conflicting formatting of data such as dates & initials. To resolve this, I created a drop-down menu for each using the data tab > data validation > allow to list and selecting a column of operator initials I created in a separate tab. For the dates, I forced the formatting to use XX/XX/XXXX only.
2. Creating the Database, Pivot Tables & Charts
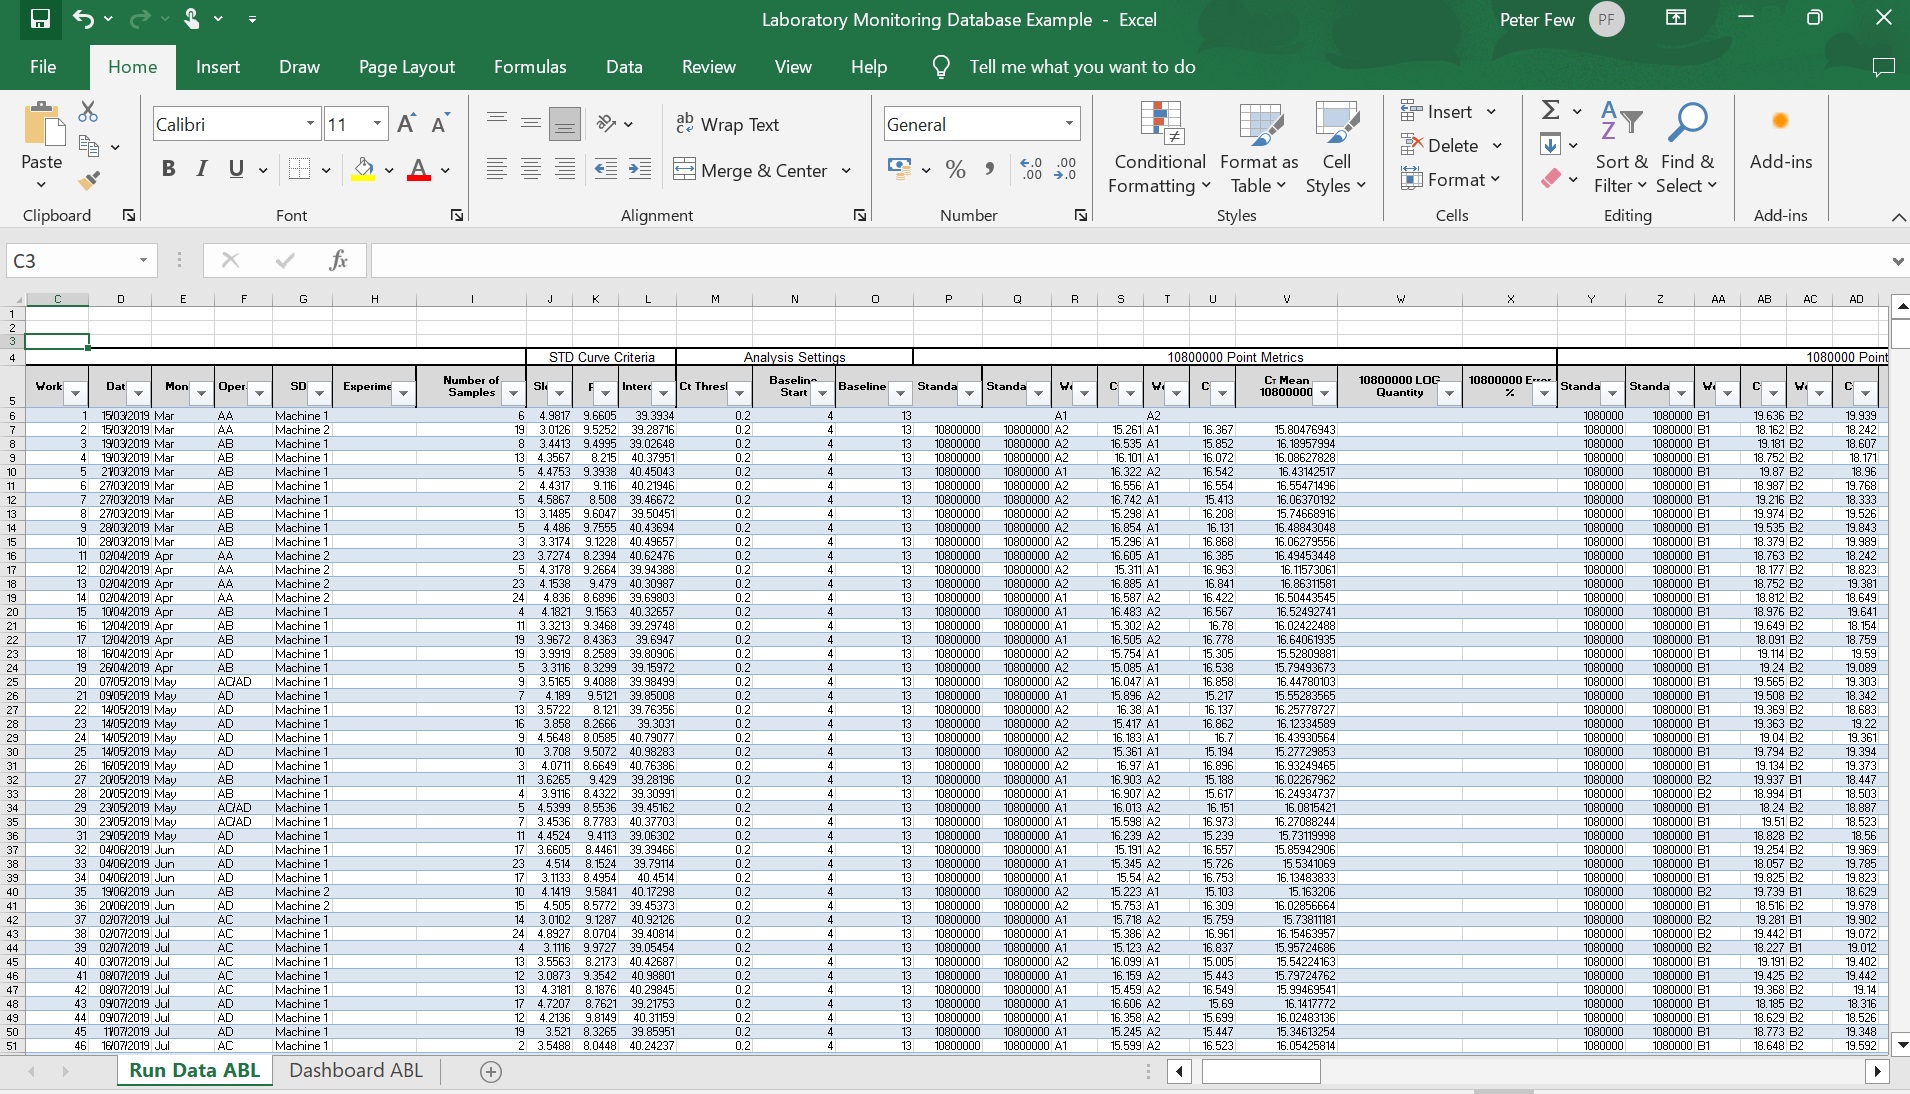
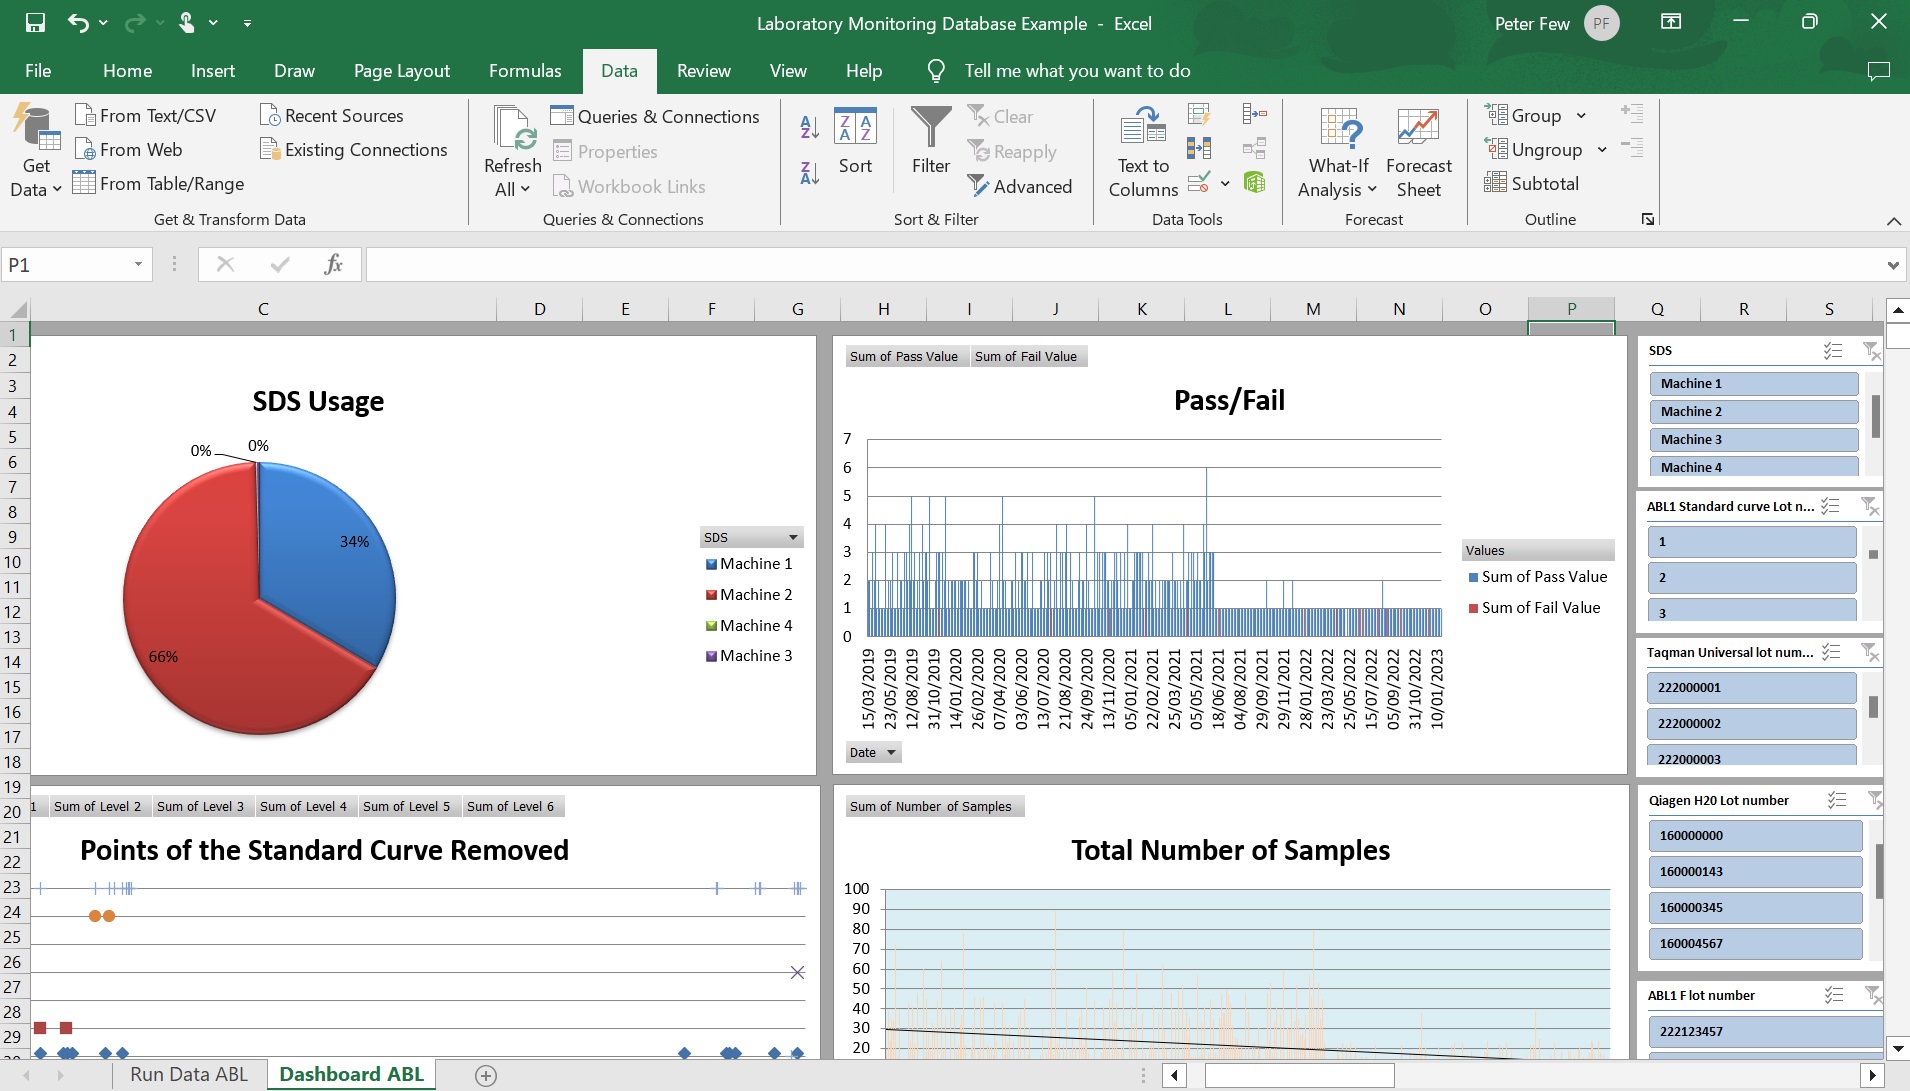
I could now copy and paste this data output directly into my new database table. I created pivot tables and charts for quality monitoring variables such as: number of samples, pass/fail rate, slope value & machine used. This meant that once a new line of data was added to the database table, the operator simply needed to select the data tab > refresh all, to update the graphs. I then added slicers to filter for the machine used, lot numbers for all reagents, groups of previous months, or by fiscal year. This database dramatically decreased the amount of time it took to make annual reports, helped us troubleshoot issues earlier, and met the strict requirements of our accreditation service (UKAS).
I have replaced the real data using the RANDBETWEEN and copy and replace functions, to ensure no sensitive information is shown here.
Database Table
Pivot Charts
3. Creating a Dashboard in Power BI
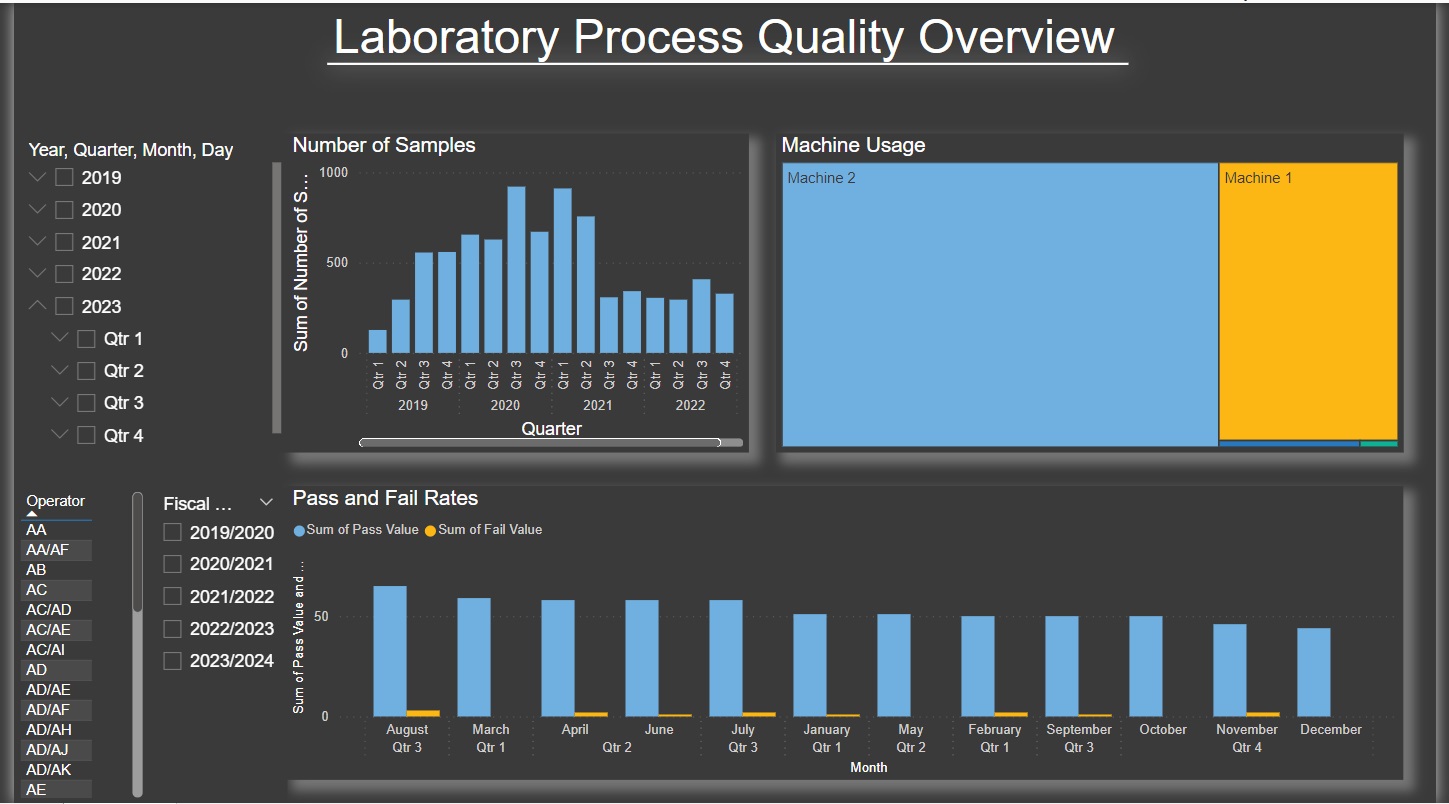
For the final part of this project, I decided to create a dashboard in Power BI as it is more suited for reports than Excel. I fed the database into Power BI and simplified the graphs showing only the number of samples, machine usage & pass and fail rates as these were the main values needed for the annual report. I added filters for the operator, Fiscal year & year, quarter, month & day so the user could create the exact report they needed. I have used a generic title here to protect the original data set.
Power BI Dashboard